Infrastructure rankings often make headlines, but most people never see what those rankings actually represent on the ground. A state can move up or down in a ranking because of bridge conditions, transit investments, freight corridors, road quality, maintenance backlogs, or population growth that outpaces construction.
For California, the conversation is especially complex. The state supports some of the busiest freight routes, largest metropolitan regions, agricultural corridors, and technology centers in the country. Looking at a california infrastructure ranking without understanding those demands can paint an incomplete picture.
From a pavement perspective, infrastructure quality is less about a single statewide score and more about how different regions manage traffic loads, maintenance cycles, and long-term investment.

Infrastructure Rankings Reflect Competing Priorities
California’s transportation network serves millions of daily users. A coastal roadway exposed to salt air faces different challenges than a freight route in the Central Valley or an urban corridor in the Bay Area.
Because of this, infrastructure rankings often measure several conditions simultaneously:
| Infrastructure Factor | What It Often Reflects |
|---|---|
| Pavement condition | Surface quality and rideability |
| Bridge condition | Structural maintenance and rehabilitation |
| Traffic congestion | Demand versus available capacity |
| Transit access | Alternative transportation options |
| Capital investment | Long-term infrastructure funding |
| System resilience | Ability to handle growth and environmental stress |
A roadway may be structurally sound while still experiencing congestion. Another corridor may have smooth pavement but insufficient capacity for modern traffic volumes. Rankings attempt to balance all of these variables.
A Site Walk Often Reveals More Than a Statewide Score
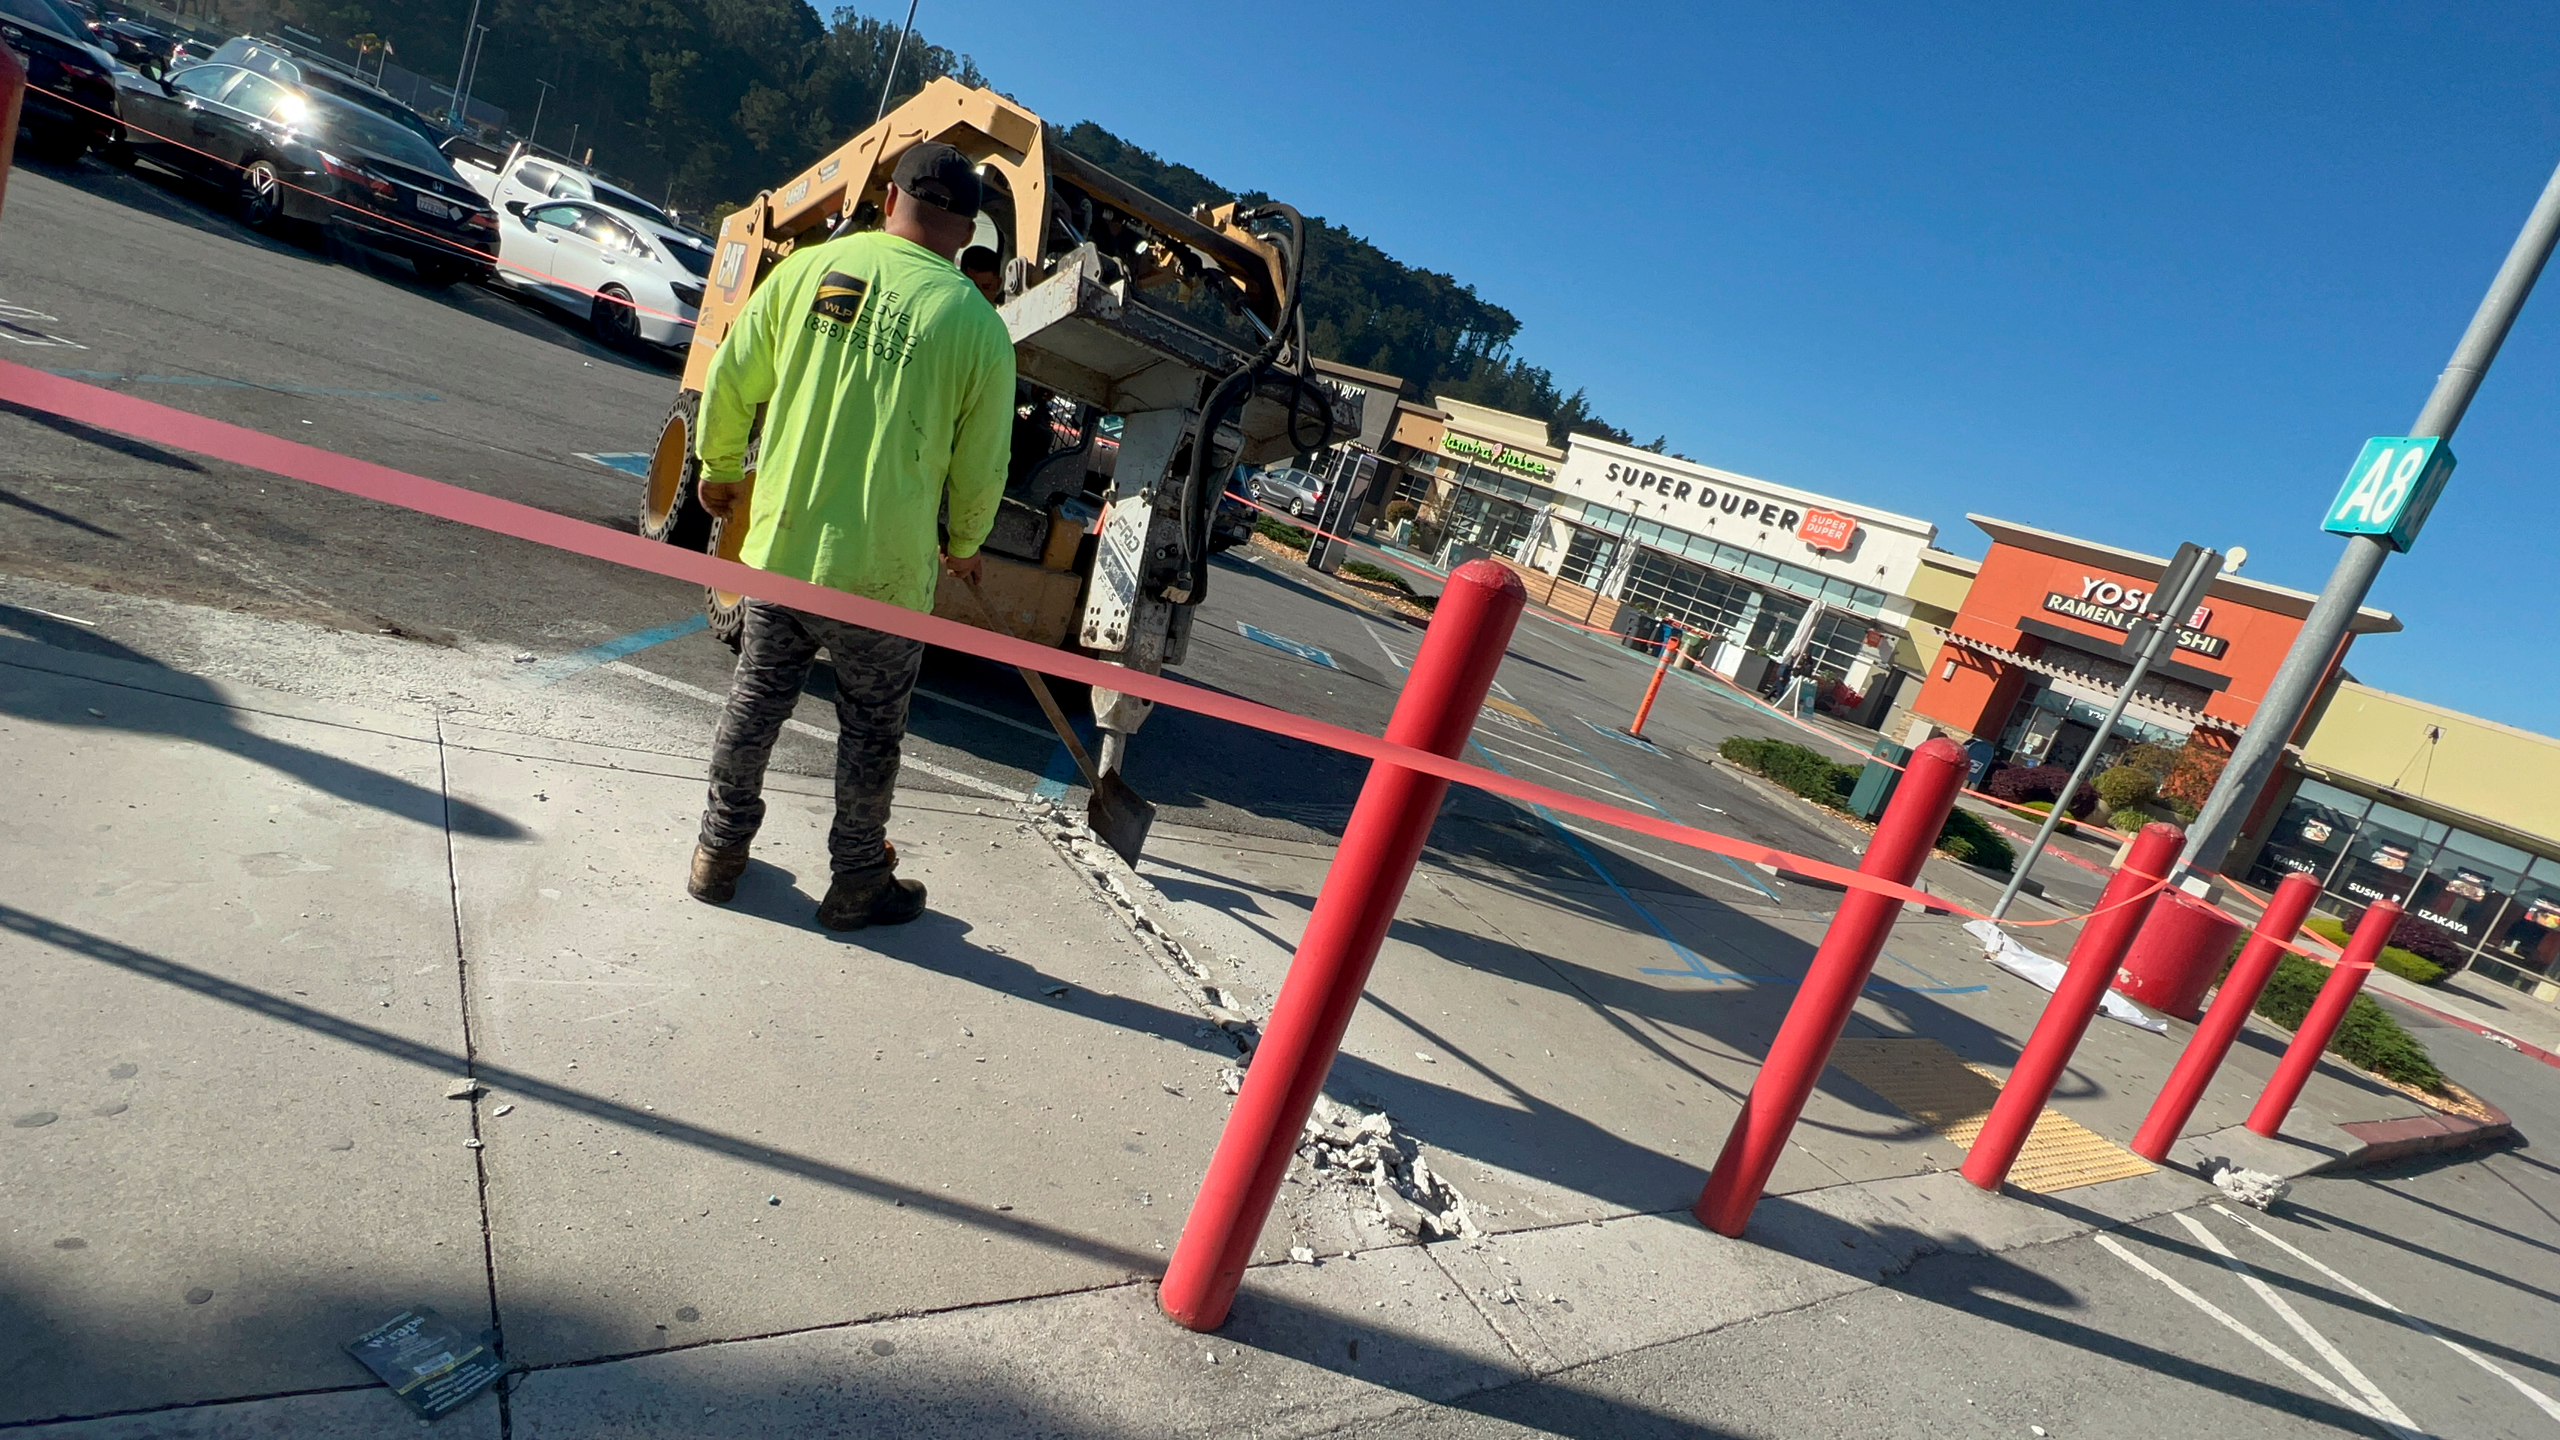
When pavement professionals evaluate infrastructure, they typically notice conditions that rankings cannot fully explain.
In heavily traveled corridors, wheel paths may begin polishing before the rest of the pavement shows significant wear. At major intersections, rutting often develops where vehicles repeatedly brake and accelerate. In older urban areas, utility cuts can create uneven surface performance even when surrounding pavement remains relatively new.
For example, areas experiencing rapid development may see infrastructure stress emerge before major deterioration becomes obvious. Growth trends discussed in regions influenced by Napa growth illustrate how increasing activity can place additional pressure on transportation assets long before a ranking changes.
These conditions become especially visible throughout Northern California, where traffic patterns vary dramatically from one region to another.
Why Northern California Creates Unique Infrastructure Challenges
The infrastructure conversation becomes even more interesting when comparing rapidly developing regions. Conditions observed across East Bay paving markets frequently differ from those found in lower-density service areas because transportation demands are fundamentally different. Northern California combines several infrastructure environments within a relatively compact geographic area.
The Bay Area experiences intense commuter traffic and dense urban development. Agricultural regions support heavy truck traffic moving goods throughout the state. Mountain communities face weather-related maintenance challenges. Coastal areas deal with moisture and environmental exposure.
As a result, pavement deterioration rarely appears uniformly.
A facility manager might notice:
- Surface raveling beginning near busier entrances before the rest of a lot shows wear.
- Localized settlement around utility structures despite otherwise good pavement conditions.
- Turning areas developing stress cracks sooner than straight traffic lanes.
These are practical signs that usage patterns often matter as much as age.
Rankings Change When Maintenance Becomes Predictive Instead of Reactive
Waiting until widespread failure appears usually creates larger rehabilitation costs. By contrast, agencies and property owners that identify issues earlier often preserve pavement life more effectively.
This principle applies whether evaluating a state highway system or a commercial parking facility.
One of the most important factors influencing infrastructure performance is maintenance timing.
For example, a pavement section may still appear acceptable from a distance, yet closer inspection could reveal:
- Joint separation allowing water intrusion.
- Edge deterioration near drainage paths.
- Surface oxidation creating aggregate loss.
- Localized depressions where water remains after rainfall.
These observations help explain why maintenance planning influences infrastructure outcomes so heavily.
Modern approaches increasingly rely on data collection, condition monitoring, and emerging technologies. The work being explored through paving innovation demonstrates how infrastructure decision-making is gradually becoming more predictive rather than reactive.
What Property Owners Can Learn from Infrastructure Rankings
Statewide infrastructure rankings may seem disconnected from private property management, but the underlying lessons are surprisingly similar.
Infrastructure systems perform best when operators understand three things:
First, assets deteriorate at different rates depending on usage.
Second, visible damage often appears after underlying conditions have already progressed.
Third, maintenance budgets work more efficiently when projects are prioritized before deterioration accelerates.
A commercial property experiencing heavy delivery traffic may face challenges similar to public freight corridors. A pedestrian-heavy campus or mixed-use facility may encounter issues that resemble municipal transportation networks. In those situations, improvements such as sidewalk repair or targeted pavement rehabilitation become part of preserving long-term usability.
Looking Beyond the Rankings
A california infrastructure ranking can provide a useful snapshot, but it rarely tells the entire story. Infrastructure quality depends on traffic patterns, maintenance strategies, funding priorities, environmental conditions, and regional growth pressures.
For property owners, facility managers, and business operators, the most valuable lesson is not where California sits on a list. It is understanding how infrastructure performs over time and recognizing the early indicators that influence long-term costs and usability.
At We Love Paving, infrastructure discussions are most useful when they connect broad transportation trends to the real conditions people see every day—from heavily traveled commercial corridors to local access routes and private properties that rely on durable pavement performance.